Whose Community Is This?
Mathematics of neighborhood displacement
Illustrator: Jeff Zoline
The equation went up on the board as my 12th-grade “math for social justice” class silently and soberly stared at it.
150,000 – 291,000 = 92,000
I talked as I wrote: “You’ve paid $291,000 on a $150,000 mortgage, and you still owe $92,000. Check that math out. That’s good math, let’s look at that math: $150,000 minus $291,000 equals $92,000. (I pause for 20 seconds as students look and mumble to themselves and neighbors.) Think about that. Hey! You started with a 150, you paid 291, and you still owe $92,000. What’s going on here?”
Antoine: “They’re taking your money.”
Daphne: “The bank is taking advantage of you.”
Rico: “This is legal—this is how banks lend money and make money.” I paused and repeated it slowly. “This is legal—this is how banks lend money and make money.”
I asked students, “What are some questions you could ask here?” Renee said, “Why is it legal?” Daphne asked why more people didn’t look into it so they wouldn’t end up in that situation.
So went a typical day in this class, one in which everything we did focused on learning and using mathematics to study students’ social reality. I wanted students to understand the root causes of oppression in their lives—read the world—to prepare them to be able to change it—write the world—as they see fit.
Our Setting
We were in the Social Justice High School (“Sojo”) in Chicago’s Lawndale community. Sojo was born through a multiyear battle in the 1990s for a new high school in Little Village (South Lawndale)—a densely populated, large, Mexican immigrant community with one overcrowded high school. A victorious 19-day hunger strike by neighborhood activists in 2001 (see “Communities Struggle to Make Small Serve All,” summer 2005) forced the district to build the new school. In 2005, Sojo and three other small high schools opened on one campus. Although the building is in South Lawndale, 30 percent of the students are black, from the bordering community of North Lawndale, and the other 70 percent are Latina/o. Almost all students are low-income (~97 percent) as Lawndale, a spiritually and culturally rich community with deep reservoirs of resilience, is also economically battered. Sojo is a quality neighborhood public school, not a charter, alternative, or selective-enrollment school; any student in Lawndale can attend any of the four schools. I was part of Sojo’s design team and have worked there since 2003. I taught this class in the 2008–09 school year.
Studying Neighborhood Displacement
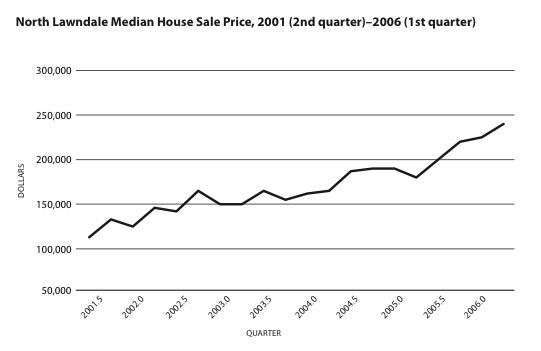
Displacement was part of students’ realities—gentrification in North Lawndale, deportation in Little Village, and foreclosures in both. I started the unit by telling the story (with family permission) of Carmen, a student in class. Her grandmother paid off her North Lawndale mortgage years before but, because of rising property taxes and a leaking roof, took out a subprime (adjustable) home equity loan. When the rate set upwards, she lost the house. The families of two other students in class were struggling to stay in their houses, and boarded-up homes were all around. As students discussed their lives and observations, then analyzed local house prices (see graph), their questions emerged: Will we be able to stay here? From where and how does gentrification arise? What is the original purpose or plan? Why our neighborhoods? Where are families supposed to go?
To study displacement, students initially learned discrete dynamical systems (DDS). A DDS is complex, and even simple ones can behave chaotically. A DDS has at least one baseline and one recursive equation, and one can use them to produce a mortgage or credit card schedule. (More complicated DDSs have multiple sets of equations, with which students learned to model HIV/AIDS transmission in Lawndale later that year.) For example, the monthly payment on a $150,000, 30-year, fixed-rate mortgage at 6 percent annually is $899.33. Its DDS is:
a0 = 150,000.00
[an represents balance due at start of month n]an+1 = an + .005an – 899.33
[what you owe at the start of a month is what you owed the previous month, plus the interest on what you owed, minus your monthly payment.]
My plan, specifically about mortgages as part of the larger unit, was for students to unpack them and see how much more than the actual cost of a house one actually pays over the years. In addition, I wanted students to understand how subprime (high-cost) mortgages worked, the relationship of interest to principal, concepts like negative amortization, and more. My concern was that students begin to appreciate how banking works as part of a larger capitalist economic system and its relationship to their lives and experiences.
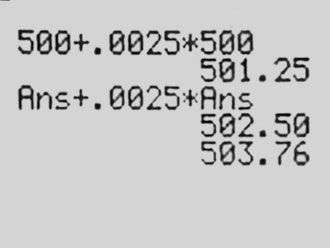
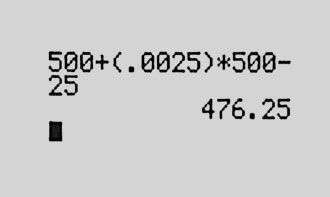
I started by teaching students to use a DDS to model an interest-bearing savings account and gave them an assignment to put their knowledge to use. The next day, we began by reviewing the homework: Create the DDS and find the balance after one year on a $500 deposit at 3 percent annual interest.
Marisol wrote on the board:
a0 = 500.00
an+1 = an + .0025 x an
Using our overhead graphing calculator, she showed the results after one month, then up to 12, and said, “So, overall in a year, you’re gonna be left with $515.21.”
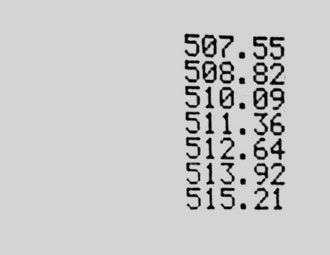
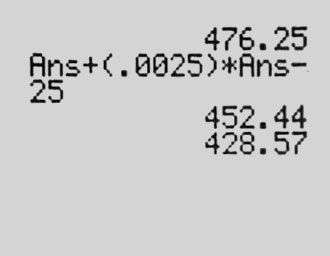
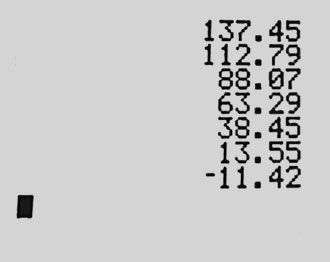
After some back and forth, with her clarifying, we moved on. The next problem was: Assume you have this $500 deposit that pays 3 percent per year, but you withdraw $25 a month. Create the DDS—when will you run out of money?
Vanessa tackled this: “OK, I did the same as Marisol, but I subtracted the $25 because you also withdraw 25 a month.” She showed us we’d run out of money in 20 months:
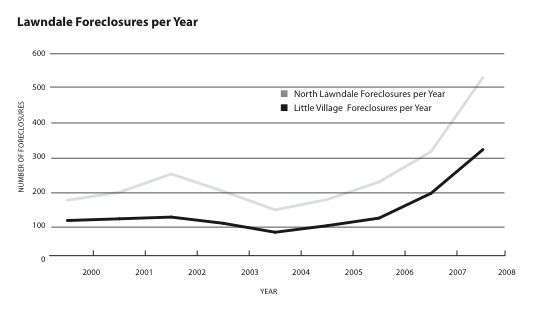
These preparations took us to the reality of students’ communities, in which foreclosures had tripled over three years. Students examined the graph on Lawndale foreclosures and discussed how mathematics reflected what they were seeing and experiencing.
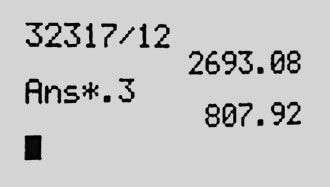
Why were foreclosures rising so dramatically? Our next step was to find how much a median-income family in each Lawndale could afford for housing without “hardship,” using the U.S. Department of Housing and Urban Development’s guideline of 30 percent of monthly income going toward housing. Minerva said that a median-income South Lawndale family—earning $32,317 a year—could afford $807.92 monthly. She explained: “I divide their annual income by 12 to get how much they earn per month and multiply that by .3 to get 30 percent.”
So far, the mathematics hadn’t challenged students much. But my next question did:
If a median-income family in your community (either North or South Lawndale) takes out a 30-year, fixed-rate $150,000 mortgage at 6 percent interest:
1) Create a DDS with a0 being $150,000 and 6 percent interest annually.
2) Determine whether they can afford the mortgage “without hardship.” If yes, how large a mortgage can they afford? If no, explain why not.
As we worked as a whole class, students’ initial attempt was:
a0 = 150,000
an+1 = an + .06an
This equation was wrong on two counts. I helped students through their first misconception: no payment was subtracted. Then Antoine said that the .06 was annual and should be .005 (monthly). Daphne, Ann, and Vanessa then discussed the meaning of each term in the equation. I stayed out of it until I pushed Vanessa to explain every symbol that Ann had entered into the overhead calculator:
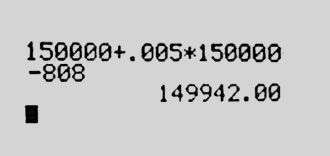
Vanessa: “. . . your monthly payment, and then $149,942 is how much you owe.”
Rico: “When?”
Vanessa: “After you give . . . your first payment.”
Rico: “Exactly. That $149,942 is what you owe after your first payment. OK, how much less than your initial payment is what you owe now?”
Antoine: “$58.”
Rico: “$58. How much did you pay? $808. Out of the first payment of $808, $750 goes to interest to the bank. Only $58 reduces your loan balance. Understand how banking works. Almost 15 times as much money goes to the interest as goes to the principal—the money you owe. That is profit for the bank. Yes, they have to pay their employees, but there is still a huge profit. That’s how they make money.”
I was trying to interweave students’ reality, mathematics, and a broader political and economic analysis, but I didn’t belabor the point and returned to the math, knowing that students would shortly uncover the “strange equation” that begins this article.
Ann then taught the other students how to set up the equation in the calculator so that each time she pressed ENTER, the calculator would show the next month’s balance.
I interrupted to refocus us: “So what is the problem? What is the question?”
Daphne: “Are we trying to see how long before they pay it off ?”
Rico: “Not only are we try—”
Carleton: “Can they afford it!”
Rico: “Yes, we’re trying to see, can they afford this mortgage? How many payments are there altogether?”
Calvin: “360.”
I had Ann press the calculator button 360 times as she counted aloud while we watched the balance shrink on the projector. After 360 presses, the board showed:
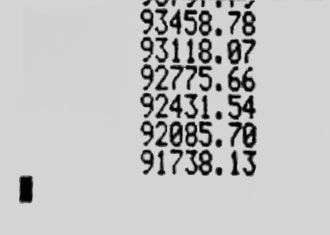
After 30 years, the family still owed almost $92,000. I asked what was the total paid after 30 years and, on the overhead calculator, multiplied 360 by $808, roughly $291,000. That prompted the dialogue and equation that starts this article:
150,000 – 291,000 = 92,000
The lesson here: No median-income South or North Lawndale family could afford this mortgage without hardship. And, as we discovered when we examined neighborhood prices, many houses were this much or more—especially new condos. A student brought in an advertisement for a new North Lawndale condo for $285,000, not including the $10,000 gated parking space.
Over the next few days, I had students answer two related questions:
- What income is needed to afford a mortgage of $150,000—a 30-year, fixed-rate, 6 percent annual interest mortgage?
- What mortgage amount, with the same terms, can a median-income North Lawndale/Little Village family afford?
By graphing the DDS on their calculators and adjusting their numbers, students uncovered that a $150,000 mortgage would require roughly a $36,000 income and that median-income families in Little Village and North Lawndale could afford mortgages of $134,750 and $84,500, respectively—not $150,000.
Although students saw and lived with displacement, understanding how and why it worked involved examining complex global processes of finance capitalism. The two Lawndales experienced displacement in ways both similar and different, due to real estate development, the economic crash, (un)authorized immigration status, geography, housing stock, deindustrialization, and proximity to public transportation and highways.
As the unit continued, I told students about a plan to build a massive gentrification complex in Little Village. Antoine was very interested, and, at my suggestion, we investigated after school. Through internet research, we uncovered that a transnational capital investment fund was trolling the globe for investors to profit from displacing him from his community. Antoine was livid and presented his findings to the class, including a four-minute promotional video for the proposed development.
Students also delved into the math of subprime mortgages to better understand how banks profited from them. They were fascinated by this topic. I had students create a scenario, including some negative amortization, for each of three types of subprime mortgages: adjustable-rate, pay-option, and balloon mortgages (respectively, a mortgage whose interest rate changes or “adjusts” periodically; one in which the buyer has the “option” to decide how much to pay per month within limits, often accumulating negative amortization; and one in which the whole balance becomes due and “balloons” at the end of a relatively short period, e.g., seven years). They were to turn in, for each:
- The mortgage terms as they changed—i.e., interest rate, amount borrowed, monthly payment, and number of months.
- A table showing how much the borrower paid at different time periods, at what interest rate.
- What the borrower paid over the loan term, itemizing principal, interest, and refinancing costs, if a balloon.
- A comparison of the total amount from #3 with the cost of a 30-year, fixed-rate, 6 percent per year mortgage.
Immigration and Deportation
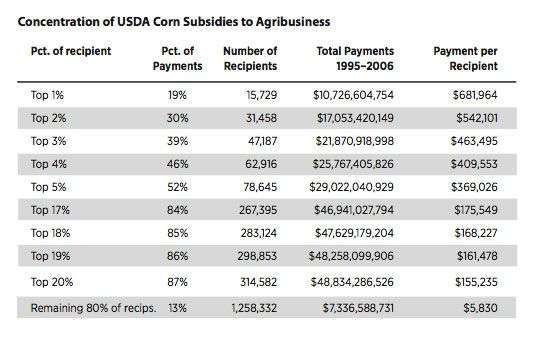
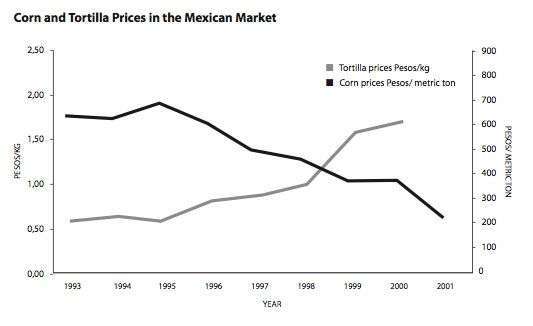
In the second part of the unit—immigration and deportation—students investigated the complicated role of the U.S. government and NAFTA in displacing Mexican farmers from their land to the maquiladoras along the U.S.-Mexico border, and eventually to South Lawndale—where displacement for unauthorized migrants does not just mean out of the neighborhood, but out of the country itself. We studied the table showing the concentration of USDA corn subsidies to agribusiness and examined the graph showing that, after NAFTA, the price paid to Mexican corn growers dropped while the cost of tortillas soared (further impoverishing rural Mexicans and increasing migration). Students investigated and created graphs showing how corn subsidies to U.S. agribusiness were highly concentrated in huge conglomerates (e.g., the top 1 percent of companies receiving the largest subsidies collected, on average, 117 times more than firms in the bottom 80 percent). We considered how these subsidies undercut Mexican farmers who could not compete with cheaper, imported U.S. corn, and how this contributed to displacement from the Mexican countryside.
Students also analyzed data on Mexican migration to the United States in relation to NAFTA policies. We looked at the concentration of Mexicans in various U.S. occupations, examined the volume and rate of change of immigration over time, and used linear and quadratic regression to analyze and predict future immigration trends. We studied, graphed, and analyzed the loss of manufacturing jobs in Lawndale over time and discussed this in relation to demographic changes, NAFTA’s rise, and capital’s drive to maximize profit by leaving areas with well-paid union jobs to reduce costs. These explorations helped students understand the complexity and multiple ways that people in both Lawndales experience similar and different ways of being displaced.
Taking It to the Community
As a way to “write the world,” students held two public forums to share what they learned with family, friends, and community. The public presentations (which they titled “Our People, Our Issues: Math as Our Weapon”) were at the end of the year, one in each neighborhood. Students created an 81-slide presentation, with my minimal feedback and editing. Although we didn’t have time for a full run-through and students were anxious the first night, they presented what they had learned and received much positive feedback.
For example, the students who presented on immigration showed the following slide:
NAFTA’s Impacts on Mexico:
- Corn subsidies to large U.S. corn growers
- Cheaper to produce U.S. corn
- Cheaper to import U.S. corn than grow in Mexico
- Mexican government stops corn price supports
- Mexican government stops tortilla price controls
- Immigration increase to the United States
The theme that both Lawndales have more commonalities than differences surfaced strongly at the forums, as their presentation’s final slide captures:
Why Should We Care?
- Both communities face the same problems but different situations.
- There are many lies and stereotypes about both Mexicans and African Americans:
> “Mexicans steal the jobs of U.S. citizens.”
> “African Americans are lazy.” - Don’t let them pit us against each other!
In written reflections, students said they felt good that they had informed their families and communities, applauded their own and classmates’ collective presentations, and critiqued themselves for insufficient preparation, nervousness, and reading too much from their PowerPoint. To a person, students thought it was worthwhile and important to teach their people. From my point of view, providing students the opportunity to “take it to the community” and share what they learned is an important component of teaching for social justice and lets students develop competencies that they will need as future agents of change.
Reflections
Developing and teaching a curriculum that supported learning about these interlocking sociopolitical processes and college preparatory mathematics challenged me, despite my experience with critical math. My academic goal was for students to learn serious math—precalculus, algebra, discrete mathematics, quantitative reasoning, and statistical analysis—to better understand neighborhood displacement, and to appreciate math’s usefulness in doing so. It’s nonnegotiable that students learn math to have full opportunities for education, life, and individual/community survival. Social justice mathematics demands this as part of supporting marginalized communities’ self-determination, and educators cannot shortchange students’ mathematical learning or life chances.
My sociopolitical goal was, as much as possible, to have students understand the causes, mechanisms, and roots of displacement in each neighborhood. I wanted them to see that both Lawndales have the same larger context—a global political and financial system that plays out in particular and sometimes contradictory ways—and, thus, whatever differences students saw between their own and others’ communities were far outweighed by commonalities.
Did all my students achieve this? I cannot definitively say. Not all students learned the same amount, based on my assessments of their mathematics learning and sociopolitical understandings. In hindsight, creating and teaching an interdisciplinary curriculum through which students could unwind the interconnections of neighborhood displacement was more complicated than I had anticipated for both students and me. Nonetheless, students said they learned a lot. In a reflection, Mónica, a Latina and lifelong South Lawndale resident, wrote:
Some connections that I see between these two parts of the unit are that in both communities, people are being forced out of their homes. Of course, it’s different situations, but similar causes. African Americans are being forced out of their homes because they can’t pay for their homes. The taxes go up so much that they can’t afford to keep living in those communities, so they are forced to look for another place to live. For Mexican people, the problem is that they don’t have jobs in Mexico because corn isn’t being sold, because it’s cheaper to import subsidized U.S. corn than to grow their own. That forces Mexicans to leave their family and homes to come to the U.S. to look for a job. . . . Also, the house mortgages don’t only affect one community, but both. They are sometimes the target of bad loans that only make banks richer! I want the people in my community to know that we are really similar in these situations. That there is more that makes us similar, less that makes us different. If we want to fight the bigger people out there, the best way is to unite. Fighting each other is not going to take us anywhere. I think this is something very important our community should know.
Renee’s comments were particularly powerful in linking the unit to her reality as a Latina:
The unit made many relations between black and brown communities. There are so many misconceptions about black people as well as brown. Both communities think bad about each other. In the black community, they might say that Mexican people don’t belong in this country because we’re illegal aliens. As well, there are Mexican people who say that all black people have a Link card and spend all their money on clothes, etc. What people don’t understand is that we both have the same struggles. They might seem different because of the color of our skin but deep down inside our parents struggle to get by with sicknesses, drug addictions, or unemployment. People are dealing with foreclosures and then become homeless. . . . When we did the 30 percent of the median household income for both communities we figured that we can’t afford the houses that we are living in. Our family members kill themselves in factories trying to make ends meet. This unit taught us that we have the same struggle. People always ask what similarities do we all have, and this unit tells us why we are the same.
As for how mathematics helped them, Carleton explained what he learned, critiqued the system, and wrote about helping others:
Learning the dynamical system helped me really understand how and why people were losing their homes. It showed how small of an amount of income the average black/brown family was making and how, since it was a small amount, how hard it was to pay off the mortgage loans. Not only was it hard but the banks were really stealing money from these people because they would end up paying a double amount of money than they took out because of this thief called Interest. . . . These were also the most important things that I learned because they helped me understand what I know now. It helped me to be able to predict whether or not a family would be able to pay off their loan with certain types of mortgages, and this is very important in being able to read the world so we can be able to share with the world.
And Renee used what she learned to analyze her own particular circumstances:
It’s crazy how banks give you this loan with a monthly payment that eventually people don’t really get out of debt. There are people who don’t know this and believe in their capitalist country. People need to know what happens—why they get into debt, especially that what the banks do is legal with our government. People such as my sister lose their homes because they don’t read the papers they are signing when they get a loan for a mortgage. People need to know the difference between the different loans that are out there. The only question that I have after this unit is can what the banks do be made illegal?
The most helpful part of this unit was the dynamical systems. As soon as I really learned how to work with the dynamical systems, I came home and grabbed my credit card bill and the mortgage and plugged them into the calculator. Paying the minimum balance on my credit card wasn’t enough. I would have to pay double my minimum balance to get out of it in less time. Obviously, what my mother is paying isn’t enough to finish paying the house in 30 years. The worst part about this is that what she pays isn’t 30 percent of her income—it’s more.
Despite these and other students’ claims of understanding DDSs and finding them useful to read the world, learning the math, with conceptual understanding, was not easy. Almost all my students had attended under-resourced neighborhood schools that, despite many teachers’ efforts, insufficiently prepared most for advanced mathematics. Some students in class had solid mathematical backgrounds, some quite shaky ones, and others in between. However, I believe two factors contributed to students’ persistence. First, students were overall engaged in the year’s topics, which they chose to study and which were personally meaningful—the 2008 presidential election, displacement, HIV/AIDS, criminalization of youth/people of color, and sexism. Second, math provided a way to understand their lives and answer their questions, including: Whose community is this?
Conclusion
It was important that students came to understand, as Renee said, that they had the same struggle, in a context of divide and conquer. Racism has long impacted Lawndale, and racial division between African Americans and Latinas/os is one of its many effects—in Sojo’s first years, black students were sometimes unwelcome in Little Village and even attacked after school. The displacement unit supported black-brown unity (as people here call it) by having students analyze the sociopolitical conditions of their lives—through mathematics—and realize that they have common enemies and a common struggle. As Mónica wrote, the best way is to unite to “fight the bigger people out there,” and not each other. Though not all students experienced or knew much about each other’s neighborhoods, I am confident that all students left class with a deeper understanding of their commonalities. To re-emphasize: This unit was based on interconnected mathematical and political analyses. In my view, this provides a basis for multiracial solidarity, which we will need in order to read and write the world—with and without mathematics.