Transparency of Water
A workshop on math, water, and justice
Illustrator: Martha Merson
If you are an environmental organizer, like Selene, your classroom is a conference room, the community garden, or a church parking lot. Your students are everyone—from toddlers to the elderly; they come with a variety of levels of formal education.Your goal is to increase environmental justice, community well-being, and individuals’ health.
If you are a math educator/curriculum writer with an interest in data, like Martha, you teach in adult ed and K–12 classrooms, libraries, and living rooms—anywhere you can sneak in math. The teaching starts with a provocative statistic or a document with unfathomable numbers. Your students are often math averse. Their motivation could be to earn a high school diploma or simply to learn more. Many have plans to put learning to use in their communities, churches, and families. Your goal is to encourage adults and youth to take a new look at numbers, to ask questions.
Statistics for Action (SfA) brought us together. SfA provides organizers and community members with tools and resources for understanding and using scientific data in communities affected by environmental contamination. During the project, we led an SfA-inspired workshop in Spanish designed to probe participants’ distrust of tap water and arm them with skills and knowledge to take on water quality/delivery issues.
Do You Drink Chicago’s Tap Water?
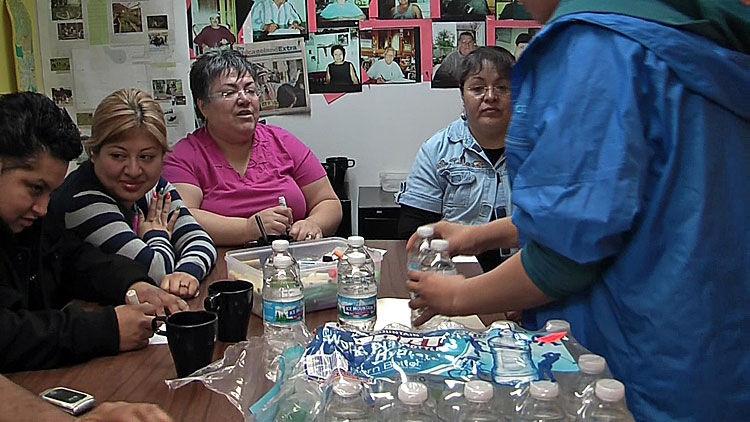
We made coffee and set up a water taste test. At 9 a.m., volunteers recruited for a six-week leadership program filed in for their 4th session. Among the participants were Carmela, a single mother, college student, and intern at Little Village Environmental Justice Organization; Elena, who is studying for a commercial trucker’s license; and two middle school students, Luna and Maria, who brought along their pet rooster. The eight participants ranged in age from 10 to 60. Their project facilitator, Norma, also a neighborhood resident, has a long history of social justice work.
We began a taste test of Mountain Spring bottled water, filtered water, and tap water. Selene instructed the participants to sample water from each of three pitchers. They examined the water in their cups, swished it around, and swallowed.
Carmela: “This is good because I’m dehydrated.”
Sandra: “I’m a dummy; they taste the same to me.”
Carmela: “It’s all the same water, I get it.” She laughs, then: “Is it?”
Elena: “It’s between A and B.”
Although divided in their prefer ences, most surprising to them was their difficulty in discriminating between bottled and tap water.
Martha then asked: “Do you buy bottled water?”
We wanted to understand why and to what extent the participants paid for bottled water. We hoped that some of their reasons would be examined in The Story of Bottled Water (storyofstuff.org), which we had queued up.
Yoana: “I buy bottled water because it’s cleaner.”
Carmela related what happened when her girlfriend offered her water: “I’m like, ‘What are you doing?’ because that’s tap water—forget about it. [But] the tap water tasted better and I would tell my mama, ‘Drink water from the tap, it tastes very good,’ and she would say to me ‘No! Are you crazy? It has chemicals.’”
We didn’t judge participants’ choices. Distrust of tap water can run deep in communities of color. Little Village, the Chicago neighborhood where the participants live, is home to more than 90,000 residents, nearly half of whom are immigrants, according to the University of Chicago. Many come from places with a history of serious water issues. In a 2011 study published in Pediatrics & Adolescent Medicine, of the parents surveyed, “Minority parents were more likely to exclusively give bottled water to their children.” Reasons cited included taste and safety.1
In 2008 the Environmental Working Group published results of their investigation of 10 popular brands of bottled water in nine states and found a total of “38 chemical pollutants . . . with an average of eight contaminants in each brand,” including industrial solvents and fertilizer residue.2 Consequently, the reliance on bottled water in communities of color is a serious concern. In addition to the ecological and economic issues related to bottled water use, these communities are disproportionately at risk for health consequences associated with bottled water.
Selling the Public on Bottled Water
Selene introduced the group to the video, which illustrates the trend away from tap water and toward bottled water, situating this shift in a larger context of manufactured demand. She asked the group: “Twenty years ago, people in the United States rarely drank bottled water. So how did so many people’s opinions change?”
Annie Leonard, the film’s narrator, throws out intriguing facts. In a common sense way, she explains how bottled water is a problematic product along its whole life cycle: It takes petroleum to make the bottles, and we know how devastating oil spills can be; it takes fuel to move the bottles around and that pollutes the air; and then the bottles end up in trash cans or by the side of the road. Of those that make it to recycling centers, only a few are actually recycled. Leonard’s message is simple: “We’re trashing the planet; we’re trashing each other; and we’re not even having fun.” Although ads may promise glamour and bottled water manufacturers say their product meets consumer demand, in taste tests across the nation, people chose tap water over bottled water. The animation of this point, a stick figure spitting out bottled water, adds comic relief to the disturbing story Leonard spins.
Two minutes into the video, we paused to let this fact sink in: Bottled water costs 2,000 times more than the cost of tap water. At 3:46 minutes in, we heard and captured this: One-third of bottled water sold in the United States is filtered tap water. At 4:42 we paused to record: 80 percent of plastic water bottles go to landfills.
Leonard goes on to explain why the trend toward buying bottled water took off by defining manufactured demand as the force that drives the production of goods. “In order to grow you have to sell stuff.” When soft drink companies feared a drop-off in business, they fabricated the need for bottled water by inducing fear, making bottled water look seductive, and misleading the consumer. Marketed as a beverage, bottled water companies avoid the rigorous testing the Environmental Protection Agency requires of municipal water systems.
In the final minutes of the film, Annie sends out the battle cry: “Take back the tap!” She makes clear that viewers can take action and make a difference to save our right to clean water. After viewing the video, we asked: Was there anything surprising?
Sandra spoke up: “I did not think that the bottles would be [piled up] . . . just like that, mountains and mountains [of bottles]. . . . I used to consider myself ‘damned’ because I could not buy this type of water. A friend would tell me ‘You’re drinking dirty water from the tap!’ But tap water isn’t bad; they’re just charging us double.”
That was an important point. We wanted participants to create sound bites drawing on one of the three statistics and their experiences, imagining that they were talking to a neighbor who hadn’t seen the film. Selene planned to elicit an example, stating a fact with a fraction, a percent, and a ratio.
Selene: “Instead of a third, what’s the percentage?”
Elena: “¿Un tercio?”
Carmela: “Oh, we learned this in school—1.3.”
Elena: “9 percent.”
Carmela: “How did you get that?”
Elena: “Cause you divide three times the decimal.”
Selene: “What do you know about a third? Is it more than a half?”
Elena: “It’s more.”
Juan: “It’s less.”
When Elena said a third was more than half, we realized that she was unclear about more than the fraction-percent conversion. Because others were struggling too, we opted to slow down, to play with different ways to show these fractions. We treated this opportunity with great respect, conscious that it takes courage to learn the basics in public.
Selene: “If this is a complete bottle of 100 percent, half would be 50 percent and a third would be a little less, because it is three parts that make it complete, and so it has to be of three equal parts—one, two, three.
We tore open a 24-pack of bottled water brought as a prop, inviting the group to show us one half. They quickly separated the 24-pack into two groups: 12 in each. We wrote “12 is half of 24” on the board and asked them to explain how one-half is like 12/24. The school-age participants smiled knowingly. We all agreed that another way to say one-half is one out of every two.
“One-third of the bottled water sold in the United States is from the tap.” We challenged the group to show us with the 24-pack. Now they could see that “one out of two” is more than “one out of three.” Half the 24-pack was 12; one-third was only eight. A participant demonstrated one-fourth to emphasize the relationship between the change in the denominator (increase) and the number of bottles set apart (decrease).
We spent a little time on the second statistic, especially because Sandra had mentioned that bottled water costs double. Her statement communicated the gist of the situation—consumers are paying dearly for water—but it massively understated the amount. The film draws an analogy between paying for bottled water and a consumer paying $10,000 for a hamburger. To explore the comparison between the cost of bottled water and tap water, the group listed current prices and calculated price tags 2,000 times higher. For one gallon of gasoline—$8,000!
Selene summarized: “Would one spend that much money on gas? But that is what we are spending in reality on water.”
Murmurs and head shaking indicated the group members were impressed. Bottled water is overpriced, and bottled water companies are generating big bucks from consumers’ willingness to pay the price.
The Transparency of Water:
See for Yourself
Ultimately, we want residents to make informed decisions based on data rather than on suspicion or misinformation or even faith in us. In the beginning of the video, Leonard reminds viewers that “in many ways bottled water is less regulated than tap.” The Food and Drug Administration (FDA), which regulates bottled water in the United States, “does not have the ability to require the submission to the agency of results from the testing conducted by and on behalf of bottled water manufacturers, and . . . does not have specific authority to mandate the use of certified laboratories,” according to testimony given by the FDA to the U.S. Department of Health and Human Services.3
We felt that it was vital to draw this distinction. Although there might be legitimate concerns about what lurks in tap water, at least it is a matter of public record. People voice all kinds of fears about the tap water, but they can read water test results, answer some of their own questions, and make specific demands of their government. Having information about our drinking water allows people to take action. This is the case in California, where residents are fighting to be the first state to set a limit on the carcinogen hexavalent chromium.4
To this end, we examined Chicago’s water report, which we distributed to participants. Municipalities have to report to residents annually, but few people know that or have ever read them. We asked participants: “What do you know? What do you want to know?”
When Norma admitted to feeling overwhelmed, Selene explained: “Parameters, what they tested for, go down the side. See anything familiar?”
All: “Chlorine, fluoride, copper, lead.”
Juan: “The water has all of this?”
Carmela: “What! There’s cyanide in our water?”
Selene: “Well, let’s see. These are all the things they test for. In the next column, we have numbers from the Illinois Environmental Protection Agency. What do you think? Why would they put numbers in a water chart?”
Yoana: “To communicate?”
Selene: “Yes, they are communicating that 200 micrograms of cyanide per liter of water is the maximum safe level. If we see a higher number there—like 250—it’s for sure a known risk. What else?”
Elena: “Some are blank.”
Sandra: “Because they are trying to figure out if it is good or bad?”
We explained that the federal guidelines for maximum contaminant levels in drinking water regulate about 100 of the chemicals in use. Municipalities test for other chemicals, but under the Illinois EPA regulations, there is no set limit for comparison, so the cell is blank.
Carmela voiced a question about the abbreviation ND. Quickly we set up a demonstration of not detected with a postage scale.
Martha: “Lab equipment tests for how much contaminant is present. Will every scale give an exact reading? For example, this scale, is it accurate for small objects?”
Elena: “Try this pen cap.”
Maria: “Try this paper clip.”
The scale registered nothing until we tried a book. Everyone witnessed reporting limits firsthand: A zero reading does not mean no amount is present. Below a certain amount, a scale simply won’t register. ND means any amount of contaminant from zero to the reporting limit could be present. Anyone reading environmental quality reports should check that the reporting limit is set below the amount considered safe.
Next we pointed out the columns listing the level of contaminants in the “raw” lake water. After treatment, sodium levels go down, while chlorine levels increase. Pairs picked one parameter, tracing how the level changed before and after treatment.
Carmela: “Cyanide is allowed in drinking water up to 200 micrograms per liter and it shows that it came in at . . . wait, when there is a “less than” sign . . . .What does that mean?”
Selene draws “<” on the board.
Carmela: “The alligator eats the bigger number!” Everyone laughs. “So less than five.”
Selene: “Exactly. That’s how I remember. I used to draw little teeth. What the alligator is eating tells us that the actual amount is less than whatever number it’s eating.”
The participants nodded and Carmela finished her assessment: The amounts for cyanide before and after treatment were less than five. Less than five what? The column specifying units indicates less than five micrograms per liter.
The time went so quickly. We had to put off an exploration of units as well as the critical notion of “safe” levels. Identifying (or explaining or determining) “safe” levels is a frustrating endeavor. For carcinogens such as arsenic, there is no such thing as a safe level, only what has been deemed “acceptable” risk. Generally standards are set to protect safety and are set based on known risks, yet many agree that standards are inadequate, because researchers know little about synergistic effects, the likely accumulated health impacts from exposure to a variety of chemicals across a lifespan. Over time, researchers may compile a body of evidence that shows negative health effects at lower levels than previously thought, but it can take years for regulations to catch up.
Setting standards is an imperfect process, one that historically takes into account costs to business and government as well as research findings. Complex as it is to make sense of levels and standards, clean water activists believe politicians will succumb to pressure from industry, as they have in the past, if communities are silent on these issues.
Participants’ Responses and Our Reflections
With limited time for exploration, it is tempting to avoid messy data sets and questions that have no easy answers, for example, “Is < 5 μg/L of cyanide safe?” Yet we wonder whose purposes are served if we take a pass. SfA resources include activities and data sets that make teaching the math of environmental data a bit easier, and hints for facilitators and participants to take control of the math (sfa.terc.edu).
Although the Common Core standards set forth a prescribed sequence for math learning, our experience shows that local, relevant data spark engagement at all levels. Regardless of their past success or failure with math, participants grasped concepts like reporting limits, explored persistent misunderstandings like the relative size of a half and a third, and coordinated information from rows and columns to identify contaminant levels. Young participants made connections to school learning.
New England-based activist Jackie Elliott once told us:
Proposers or developers of a nasty product go to communities that are naive, have low levels of education, are politically powerless, and are compromised with economic stress.
Elliott maintained that when a handful of people who have done their homework go to public hearings armed with numbers, the proposers realize they can’t put on their usual dog and pony show.
Conclusion
We considered this workshop a success. As math educators, we were pleased that the people stayed with the math instead of counting themselves out. The group got started on the path toward digging into the numbers. As environmentalists we observed participants make connections between purchasing choices and environmental consequences like mountains and mountains of trash.
On a short evaluation form, participants told us what they valued learning:
I can drink water from the sink.
I’ll know not to buy bottled water and save money.
Cost of H2O (bottled) 2,000 x more!
Conversation continued as people left. As she walked out the door, Yoana said, “They are trying to confuse the people; people should have access to water without paying so much.”
Months later, the participants of this workshop joined a protest against the mayor’s plan to privatize Chicago’s water system. They had the background to contribute to discussion about who is in the best position to monitor and safely deliver drinking water.
Clean drinking water supply is in a precarious position, threatened by fracking, pesticide runoff, and, in Chicago, privatization. Even in cities where the water routinely gets high marks, residents can’t afford to be complacent. Access to clean water, as Annie Leonard says, is our birthright; but in a capitalist economy, nearly everything is for sale and the water (system) we all rely on and need to live requires vigilant protection.
Many of us memorize and spout statistics that affirm our beliefs without so much as a glance at data sets like water quality reports. As educators and organizers, we advocate interpreting data to describe conditions. We advocate shedding light on how to calculate, quantify, and explain the costs of injustice. Workshops like this one set the stage for broader involvement in developing and understanding these statistics. This is part of a respectful approach to convincing people who’ve grown accustomed to buying water that they are shouldering an unjust financial and health burden. Intuitively many know the situation is inequitable, but facing the data can ignite a sense of urgency. Then the hard work of identifying steps for collective action begins.
Endnotes
- Marc H. Gorelick. “Perceptions About Water and Increased Use of Bottled Water in Minority Children,” Pediatrics & Adolescent Medicine. 165:10, June 6, 2011. Retrieved Nov. 1, 2012, from archpedi.jamanetwork.com.
- Environmental Working Group. Bottled Water Quality Investigation: 10 Major Brands, 38 Pollutants, 2008. Retrieved Nov. 1, 2012, from ewg.org/reports/BottledWater/Bottled-Water-Quality-Investigation.
- U.S. Department of Health and Human Services. Testimony of Joshua M. Sharfstein on Regulation of Bottled Water, July 8, 2009. Retrieved Nov. 29, 2012, from hhs.gov.
- Lyndsey Layton. “Probable Carcinogen Hexavalent Chromium Found in Drinking Water of 31 U.S. Cities,” Washington Post, Dec. 29, 2010. Retrieved Nov. 29, 2012, from washingtonpost.com.