Beyond Marbles
Percent change and social justice
Illustrator: David McLimans
In my eighth year of teaching, I hit a wall teaching percent change. Percent change is one of the few calculations taught in math classes that shows up regularly in the media, and one that I often do in my head to make sense of the world around me. Despite this, I had been teaching percent change using textbook problems about the number of marbles in a jar, which had no meaning in my 7th-grade students’ lives. I told myself that I could and must do better to engage my students’ interest.
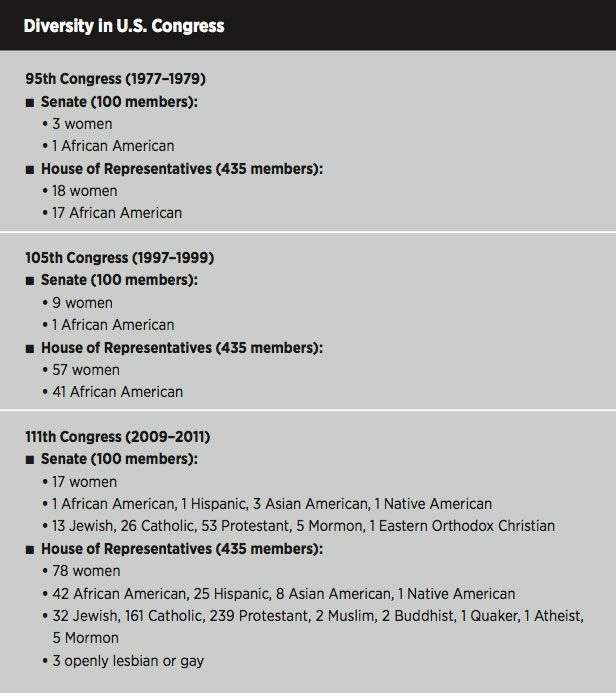
It was October 2010. I had just read that the representatives in the U.S. Congress were the most diverse group in our nation’s history, so I decided to see how dramatic the change had been over the course of my lifetime. I started with the 1979 Senate. How was it possible that, nearly 60 years after women won the right to vote, only 3 percent of our senators were women? And only one an African American?
I want my students to believe that statistics can tell powerful stories about the injustices in our society, and these numbers seemed like a good place to start. I made a handout with the data and distributed it to my students, a diverse group hailing from four New York City boroughs, vastly different socioeconomic means, and a broad range of cultural and racial backgrounds. (Although tuition at this private school is expensive, the school uses a sliding scale to calculate tuition costs, and most of the student body pays less than full tuition.) As I asked the students for their observations and reflections, I hoped they would notice that our representatives in Congress do not represent the full diversity of the country, and question the system that is responsible for that divide. The room started buzzing.
“Are we learning math today?”
“Why is there only one black senator? That’s racist!”
“Why are there so many more categories for the 111th Congress?”
“Why did you pick these years?”
Each question was followed by reactions and hypotheses. I jumped in to engage with some, but I listened and let them try to answer each other’s questions first. I made a point of engaging the students’ anger about the sole African American in the U.S. Senate. I asked them whether they thought that people decide who to vote for based on race. They noticed race as part of the last two presidential elections, but they had a much longer list of reasons why people vote as they do. We agreed that race should not be the only criterion on which people base their votes, but we were clear that there should be more African Americans in Congress.
“Why do you think that African Americans have gained 26 seats in the House of Representatives over the course of my lifetime, but that there is still only one black senator?”
“There are fewer representatives in the Senate.”
“You don’t have to get the whole state to agree to vote someone into the House.”
I reminded my students of the map of New York City’s voting districts that we look at when we’re lobbying our representatives. Keyshawn mentioned that most of the people in Harlem are black, so it would be likely that they would elect a black representative. Madeline pointed out that Chinatown probably elects an Asian American representative. I said that the district I live in is predominantly Puerto Rican and our representative, Nydia Velázquez, was the first Puerto Rican ever elected to the U.S. Congress.
“What do you think happens outside of cities?” I asked the class. “Do you think that there are districts where most of the voters are African Americans?”
“Maybe in the South?”
I used the opportunity to explain that people in power have historically gone out of their way to make it hard for African Americans, Latina/os and other people of color to end up in control of voting districts by creating strangely shaped districts that disperse communities among several districts. The Voting Rights Act—the product of civil rights activism—attempts to counter that by requiring redistricting that gives each community a fairer chance. The data that we were looking at is a good reason why we have to be thoughtful about how we set up our voting districts.
It was time to move on. I challenged my students to keep thinking about whether they could come up with a way to hold elections that would make it more likely for our representatives to reflect the full diversity of our society. Some of their questions had strayed far from mathematics, and we didn’t arrive at satisfying answers to all of them. It’s important not to get bogged down by this. Teaching social justice is never neat and tidy, and no teacher should anticipate arriving at the point where everyone’s questions about the world we live in are answered. Life is complicated, and these questions are worth asking even if we can’t always answer them.
Calculating Percent Change
Next, I put the formula for percent change on the board and asked the class how we could use the formula to calculate the percent change of African Americans in the House from the 95th Congress to the 105th Congress.

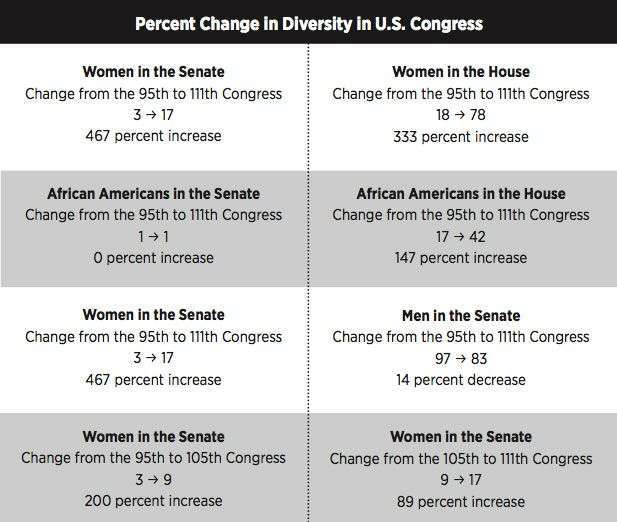
I encouraged them to think about what the words mean outside of math. We discussed what original amount means in this context and how we could calculate the amount of change (the difference between the original amount and the new amount). Once everyone felt comfortable with the example, I assigned each student a single calculation to complete and contribute to the chart on the board. I placed the elements on the chart to make comparisons easy.
The student assigned to calculate the percent change for men raised his hand and wanted to know how he was supposed to calculate when I didn’t tell them how many men there were. I intentionally left if off the list; many students’ thinking gets stuck in a box when faced with unfamiliar material. I stopped everyone and posed the question to the whole class. A student explained how to use the total number of senators and the number of women senators to find the number of men who are senators. The whole class relaxed because, even though it wasn’t obvious to all of them, they all could have figured that out. I loved that they had to think a little and listen to one another to figure out what information to plug into the formula. In the real world, that’s how math is. And it meant they were making sense of the formula and were more likely to remember it.
Looking at the completed chart gave us lots to talk about.
We looked at the difference in the percent change experienced by men in the Senate vs. women in the Senate.
I asked: “Why is the same 14 seats turning over from men to women a 467 percent gain for women and only a 14 percent decrease for men?”
“The men started out with almost all of the seats, and they still have almost all of the seats.”
“Women still don’t have very many seats in the Senate, but they’ve gained almost five times as many as they started with. That’s a big change!”
I pushed a little more: “Do you think that women feel differently now about their access to power than they did 30 years ago?”
“Yes!” a chorus shouted.
“What about men? Do you think they feel like they have less power?”
“No,” they said, shaking their heads.
For me that is the essence of percent change. In all the years that I taught percent change via textbook problems, students never really understood why it mattered what you used as the original amount. I enjoy providing my students with a context in which to make sense of this.
“What do you think is a better way of talking about the progress that women have made in the Senate?” I asked. “They’ve gained 14 seats or their representation has increased by 467 percent?”
“Four hundred and sixty-seven percent sounds like a lot more change.”
“Fourteen seats doesn’t sound like that much.”
“I don’t know, but women should have a lot more seats than we do.”
“Maybe it’s important to tell both.”
There is so much more we could have talked about, but we were out of time. It was a lively class filled with deep mathematical discussions, and my students were thinking critically about social inequities. I was excited to have helped them build more connections between math and “the real world.” And I was confident that this lesson would contribute to conversations with peers at the lunch table, with the history teacher in current events class, and with parents at dinner.
Choosing a “Real-Life” Question About Percent Change
But we weren’t done. It is a priority for me to help my students learn how to connect their curiosity about the world to mathematics. Their homework assignment was to think of a question they would like to ask about the world that could be answered using percent change, and to find a data set with which to conduct the calculations. The goal was to make a poster about it during the next class. For some students this provided an opportunity to apply their new math skill to something that they were already wondering about. For others, this was a chance to think of a new question. Knowing that they would be spending at least 40 minutes of class time engaging with their questions and that their work was destined for display pushed my students to be creative and to take the process of developing an interesting question seriously.
Students arrived at the next class with an exciting collection of questions and starts of questions. We began by sharing so I could give feedback on whether they were ready to move forward or needed to meet with me first. Hearing each other’s ideas helped students focus on their own work by quelling their curiosity about their peers, and helped students who had struggled with the open-endedness of the assignment have a sense of the possibilities. The broad range of students’ questions reflected the racial and socioeconomic diversity of the student body as well as their engagement with a broader curriculum focused on social and environmental justice, annual activism projects, and many weeks at the school farm.
The posters needed to include their question, the process of answering their question, the findings, an image, and the source of their information. The target time frame was to have posters ready to present for the following class period.
About half the class was ready to get straight to work and started gathering the materials they would use to make their posters. A few students had data sets but did not record the source of their data and were sent straight to the computers to find them.
The rest of the students needed my help. Some students asked to use the computers. Since we have only a few computers in the room, I wouldn’t let students use them until I was convinced that they had developed their question to a point at which they could be efficient. While I conferenced with students one-on-one, I asked those who were waiting for me to work with a partner to improve each other’s questions.
Kyree impressed me with a list of average baseball player salaries for every year since 1916 and I was confused as to why he felt stuck. It turned out that he had found so much data he didn’t know what to plug into the formula. It hadn’t occurred to him that he got to decide which years he was interested in comparing.
“That’s the exciting part,” I told him. “You’re in charge and get to make decisions.” I suggested that he pick a year from a long time ago and a recent year. When he decided to use data from 1980, I reminded him to compare data from this year with data from a long time ago.
“But Flannery,” he objected, “1980 was 30 years ago!”
“You’re right. It’s fine,” I said, feeling old for a second.
Since Daphne volunteers at the animal shelter, trick-or-treats for the Worldwide Fund for Nature, and focused her Bat Mitzvah on endangered species, it was no surprise that she wanted to make a poster about animals, but she didn’t know where to start. I told her to key in to a single species and make a choice between telling a story of a species in rapid decline or of a story about an intervention that has made a difference. She liked the idea of a story of hope, so I mentioned a rehabilitation project with the California condor population that has been successful. And she was off.
Keyshawn wanted to draw attention to factory farming but wasn’t sure how to go about it. I suggested that there are many quantifiable components of government guidelines and industry definitions, and listed a couple. He decided to focus on the space available to chickens.
Madeline was so excited about graduating that she wanted to do a project featuring her class. She needed to know how many people were in the first class to graduate from our school. I asked her where she thought she could find that information. She considered looking for a staff member who has been connected to the school since its founding in 1966, but then she remembered a plaque in the library with the names of the members of the first class and asked if she could go have a look at it.
Lucas wanted to focus on global warming but wasn’t sure how to quantify it. He had a list of ideas, but didn’t know which would be the best measure. I referred him to the 350.org project to see if he could understand why some scientists are looking at carbon dioxide parts per million as the best indicator of the health of our Earth’s atmosphere.
Some students I conferenced with went off to find their data right away. Others needed more than one check-in before they met with success. One student was a few minutes late to his next class because he was recording data that he unearthed. But all students went home with the information they needed to complete their posters for homework.
During the next class period, students took turns presenting their posters to the group. They were as impressed as I was by the range of questions and shocked by many of the findings.
We looked at the percent change of the:
- height of wind turbines since the 1970s
- salaries of professional athletes since 1980
- sales of organic foods in the last 10 years
- number of men and women in the Saturday Night Live cast since the first season
- living space available to free-range chickens compared to factory-farmed chickens
- audience size at Metallica concerts in the last 20 years
- size of the California condor population since a rehabilitation program started breeding them in captivity in 1982
- assets of the Apple Corporation in the last year
- global population in students’ lifetime
- number of undocumented immigrants deported from the United States since Obama was elected
- carbon dioxide in the atmosphere since the beginning of the industrial revolution
- number of colors available in a Crayola crayon box since the original box of eight colors hit the market in 1903
- teen pregnancy rates since the 1990s
- size of the graduating class at our school from the first 8th-grade class to this year
- abortion rates since abortion was legalized
- number of Yunnan golden monkeys since the opening of the Baima Snow Mountain Nature Reserve
- number of mountains in Appalachia since the start of mountaintop removal coal mining
After school I hung the posters in the staircase. Over the next several weeks I saw students from younger grades stopping to discuss the project; some even sought me out to ask whether they will get to do this project when they are in the 7th grade. Teachers at the lunch table told me they were excited to see the work.
For my students, seeing their work on the wall elevated the importance of the skill that we learned. Although we spent only three 45-minute class periods on percent change, my students appreciated the diversity of its applications in the world. They surprised me by deciding to use percent change to make sense of data in other contexts, like their projects for our social justice data fair. Their interest in percent change will also make it much easier for them to learn about exponential functions in 8th-grade math.
Although this unit could be a stand-alone, for my students it does not exist in isolation; it is part of a series of ways in which I engage my students in making connections between social justice and math. And I am only one teacher in a community of educators at Manhattan Country School whose explicit mission is to create opportunities for our students to wrestle with themes of identity, community, diversity, sustainability, civil rights, activism, and justice. I hope that my students, as citizens of the world working to create positive change, will think of mathematics as one of the tools in their toolbox.
Resources
- African Americans in Congress: http://history.house.gov/Exhibitions-and-Publications/BAIC/Black-Americans-in-Congress/
- Women in Congress: womenincongress.house.gov
- Latina/os in Congress: loc.gov/rr/hispanic/congress
- Information on redistricting: publicmapping.org/what-is-redistricting